Mermaid or Latex flow charts?

I have been reading with mounting despair about the inability to stuff simple diagrams such as flowcharts into Scrivener files.

Is this true?

I see that there is this forum section on markdown and latex and so before I go down a long, long rabbit hole can anyone tell me if you can use wither mermaid or latex to draw diagrams in scrivener?

Or perhaps I should say, will it produce the diagram as output.

You may notice that I’ve never used either mermaid or latex in scrivener hence I don’t really know how to ask the right question - forgive me, please.

And if there is a better way of creating a book with diagrams in it, do let me know - I’m targeting ePub, and pdf as a minimum.

If you are going to be using markdown as an intermediate for compilation (and you really should for anything like this), then the answer is this is no problem. There are many pandoc filters that convert text descriptions of figures into rendered images for you. For example:

Another possibility is the pandoc system https://quarto.org which enables dynamic plotting for both mermaid and graphviz, alongside all the beautiful plots R or Python can generate:

These use intermediate tools to generate images, but LaTeX itself has another set of possible packages like tikz for this. It really depends on what you want to use exactly?

1 Like

I create the flowcharts and/or other diagrams in another tool, e.g. Omnigraffle, PowerPoint, etc. I can’t think how you would use LaTeX for this, nor do I know Mermaid. Sorry.

I insert these figures into the document as PNG files. I keep the source in subfolders under Research to keep everything together. Then compile into whatever format wanted. Works a champ. Not using Markdown, but do often use the template provided by Scrivener for making LaTeX TEX files.

(Sometimes insert links to these PNG files, but I’d rather be able to see the figures as I write, so that not often what I do).

1 Like

@rms — depending on the types of flowcharts, specifying them as text is much easier than drawing them manually, so for example:

Actor 2 -> Actor 3: message 1
Actor 1 -> Actor 2: message 2

Actor 1:
Actor 2:
Actor 3:

is easier than drawing something like this in a drawing app:

┌───────┐ ┌───────┐ ┌───────┐
│Actor 1│ │Actor 2│ │Actor 3│
└───┬───┘ └───┬───┘ └───┬───┘
    │         │         │    
    │         │message 1│    
    │         │────────>│    
    │         │         │    
    │message 2│         │    
    │────────>│         │    
┌───┴───┐ ┌───┴───┐ ┌───┴───┐
│Actor 1│ │Actor 2│ │Actor 3│
└───────┘ └───────┘ └───────┘

This is why there are loads of tools like PlantUML, Mermaid, GraphViz etc. The other big advantage is your figures are stored as text with your document directly. For scientists, the idea of “literate” manuscripts is becoming more popular, where you embed the data and code that generates a figure, and this is rendered at compile rather than making figures manually. Changes to data automagically reflect in new figures, without any necessity to manually redo your figures! :nerd_face:


as an aside for anyone that wants to play with some of these tools online, there are a few text > box drawing tools to play with: Diagon: ASCII art diagram generatorhttps://dot-to-ascii.ggerganov.com for example…

1 Like

Ok. Sort of a different diaspora of flow chart drawers and readers, I guess.

Perhaps use a fixed-width font or something.

Or something other than Scrivener.

I can’t recall a scientific paper drawing figures like that, but then I lead a sheltered life.

 ¯\_(ツ)_/¯

These tools can express much more complex charts, with many different shapes. Many of these tools originated from computer scientists, and therefore focus on their domain problems (complex database designs, object oriented hierarchies). The other main patterns are things like gantt charts, you can see examples for e.g. GraphViz here:

looks great. paste/link them into Scrivener as compatible graphics files.

Scrivener itself cannot render LaTeX, but you can pass raw LaTeX (or any other markup) through to the post-processing tool of your choice.

So yes, if you want to use LaTeX to generate your charts, Scrivener can accommodate that. (See also the recent thread on LaTeX equations, as the workflow would be similar.)

1 Like

The general idea is that you keep the descriptor text in-document, and the compiler will auto-generate the graphics files for you. But to visualise them you could indeed have a temporary rendering you keep in the Binder. Marked 2 should be able to run these tools and show the rendering live while you write in Scrivener too.

I get that idea as does, I think, most Scrivener users. Just not how it works. @kewms told you that this works letting LaTeX do the compiling. So do it. Do not see the issue. Good luck.

Wow, I hadn’t expected so much activity in so little time. Thank you all for your contributions -

So the answer is yes, I will probably use graphiz or mermaid since these are more familiar to me.

Since I wish to generate different formats including fluid formats I believe it is better to express the diagrams (which are simple) in text that later goes through a processor, rather than putting an image file into the text which is not only bigger, but is not text, which makes a difference in the output - for instance if you want to highlight some text within a diagram in a pdf you’d have to put it through an OCR if you are using an image, and then resizing and so on becomes an issue. I think.

Thank you all for your rapid and fulsome contributions and pointers to processors.

1 Like

I just made a Scrivener workflow using Quarto, including both Graphviz and Mermaid examples which may be helpful: Scrivener + Quarto: a technical publishing workflow

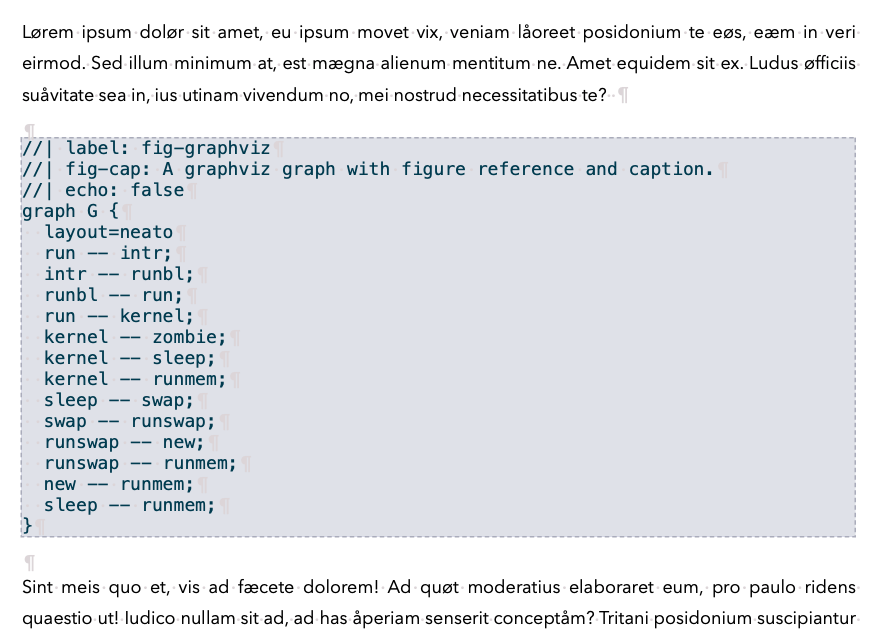
For example this in the Scrivener editor:

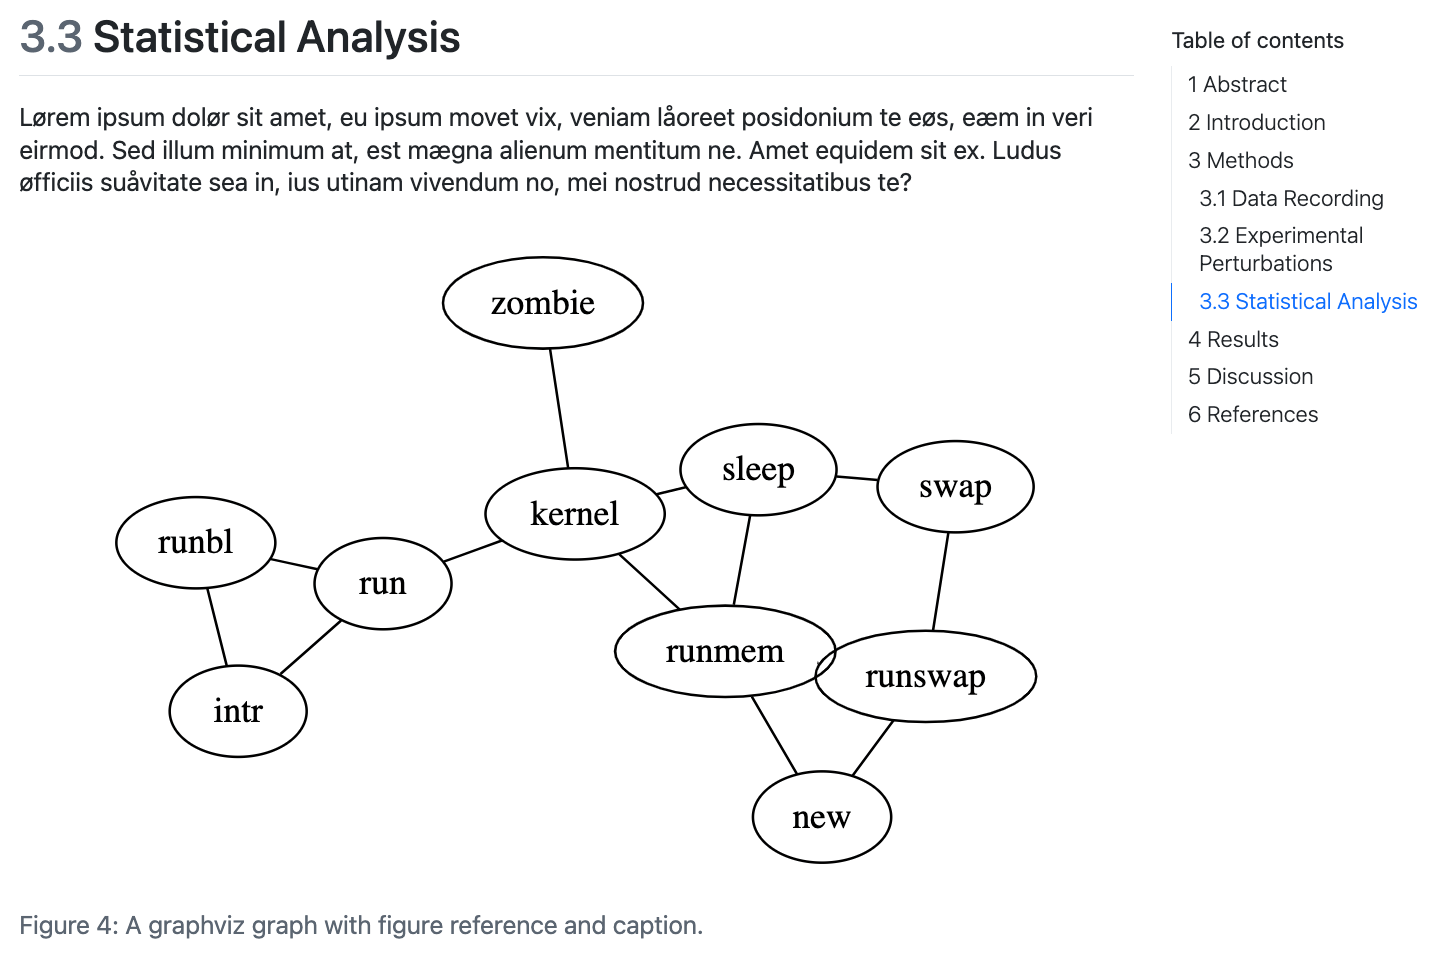
Gets turned into this on compile:

1 Like